RaceTac
Chart Features and Behavior
WARNING: The Chart feature is EXPERIMENTAL at this time. It is for testing and evaluation ONLY. Do not rely on it's accuracy.
WARNING: The Chart feature is for Sailboat Racing support, NOT GENERAL NAVIGATION. As such, it does not display all possible objects found on charts.
WARNING: The Chart feature has options under 'Preferences' to 'de-clutter' the display. SET YOUR 'SAFE DEPTH IN METERS' properly when using features like 'Show Safe Soundings'! The default is 3 meters.
NOTE: Hubbard Software does not provide charts. The Chart feature currently supports charts from the U.S. NOAA set in 'S57 ENC' format. See the Chart documentation below for details on downloading and importing them.
AGREEMENT: By Accepting the use of the Chart feature, you accept all liability for errors and/or omissions in the data and code of the chart function. You also agree to use other Navigation resources (charts and Apps) for general safe navigation. You also AGREE TO ABIDE BY U.S. NOAA's terms and conditions for using their charts. These are found on the NOAA web site when downloading the charts. As well as any other provider of charts and Tidal Current data, such as the UK Admiralty.
Chart Feature Documentation
Internet Requirements: RaceTac uses the Internet to load both Tidal Current data from NOAA and the UK Hydrographic Office, as well as Chart revision level info, also from NOAA. It does this in the background, and will retry if out of range. For Currents, it stores several weeks of data locally, so that will operate without Internet access for some time, and will sync up when you have access again. Note that the first time you run the app, it can take several minutes to load the initial current data, so the arrows might not show up on the charts right away. It will also use the Internet to download Charts and Updates to Charts from NOAA when selected via dialogs.
Chart Support: Charts for RaceTac currently supports U.S. NOAA Electronic Navigation Charts (ENCs), and S63 Licensed charts as provided by the UK Admiralty and others. These are provided in the International Hydrographic Organization (IHO) standard S57. And for many other locations that require licensing, the S63 security and authentication standard is now supported.. In theory, any S57 standard chart should work, but others have not been tested. The chart function will work without any charts loaded, but will only graph your known marks, and your boat location. It will not know of any obstructions, land, depth areas, navigational aids, etc... without loading charts for your area. S57 Charts are also known as 'Vector Charts', as opposed to 'Raster Charts'. Raster charts are actually just pictures of charts, whereas Vector charts are really a database of objects with coordinates and attributes. I chose Vector charts, and although they require much more code to support, they also allow for much more flexibility, such as interaction with screen objects as described below. Also note that NOAA is in the process of updating all the databases for these charts. So 'Raster' charts may not exactly agree with 'Vector' charts until that project is finished. However, Vector S57 charts are the future.
Chart Downloading: You can download NOAA charts directly through menus and dialogs described below. Or, load them from a ZIP file you put on your device from their ENC Website found HERE. You can access the NOAA site from you device browser, email them to yourself as attachments, or other methods. These charts sets are provided as ZIP files. Just save the zip file in a common folder like the downloads folder on your device. An Import dialog described below will access them and import them into RaceTac. For S63 standard licensed charts, see HERE.
Chart Preferences
There are a number of options available for controlling the chart behavior. Select 'Preferences' from RaceTac's menu, then select 'Chart Settings' to get a screen where you can change the settings.
The Current Settings are:
Safe Depth in Meters: In order to eliminate clutter, some options can hide chart objects if they are deeper than this setting. The default is 3 meters. So for example, a wreck may not be shown if deeper than this setting. Also, Soundings can be hidden if deeper than this.
Show Safe Soundings: When on, ALL Soundings (depth indicators) are shown. Those below the safe depth as well as shallow ones. When off, only the soundings shallower than the safe depth are shown. This is also true for coloring 'Depth Areas' such as those around the shore or a shoal area. This helps un-clutter the display.
Show Track: You can see your past race track on the Chart, color coded to indicate speed. These are saved and can be loaded into the chart for review. See below.
Show All Marks: When on, all of the Marks you have in the current Venue will be shown. When off, only those in the current course are shown.
Bearing Line: Display a line from the boat directly to the current mark.
Gate Course Lines: This pops up a choice for how the Course and Bearing Lines are drawn when 'Gates' are involved. If a Mark is actually a 'Gate', such as a start or finish line, you can choose to have the course line drawn to and/or from the middle of the lines, to and from the closest end points, or to and from the closest point on the line (a perpendicular, or closest end). REMEMBER: The closest end isn't always the 'favored end', depending on wind conditions and the tactical situation!
Chart and Boat Orientation: You can choose to have the chart locked, North up, and the boat icon moves, or the boat can be fixed in the center, and the chart moves around it with North up, and the Boat can be centered and always up, and the chart moves and rotates around it.
Range Rings: This enables rings around your boat indicating the range from the boat, much like a radar display. The distances are indicated in the 'Minor Distance' unit as set in the 'Units of Measure' preferences. The 'Range Ring Spacing' preference is the number of those units between rings. For example, '200' would show rings every 200 yards if your minor unit was set to yards.
Double Tap Sensitivity: The number of milliseconds between taps, less than which it is a double tap. Default is 500 milliseconds (one half second).
Chart Declutter Mode: Provides 3 modes to remove Mark name text under some circumstances.
- Do not declutter chart display.
- Remove Mark Name text when within specified range of a Nav Aid (see next setting) and name is the same as the aid (case insensitive).
- Remove Mark Name text when within range of a Nav Aid, regardless of a name match.
Declutter Range: Sensitivity in Mark Icon diameters from a NavAid at which to declutter by removing Mark text if same as the nearby NavAid. The Mark icon is usually a circle, so the diameter on the screen is what is used. Example: Entering 3 would mean 3 circle widths from the Nav Aid on the screen.
Depth Unit: Not under the Chart Settings, but up under the 'Units of Measure' preferences. You can choose from Feet, Meters, or Fathoms. The default is meters.
Chart Management
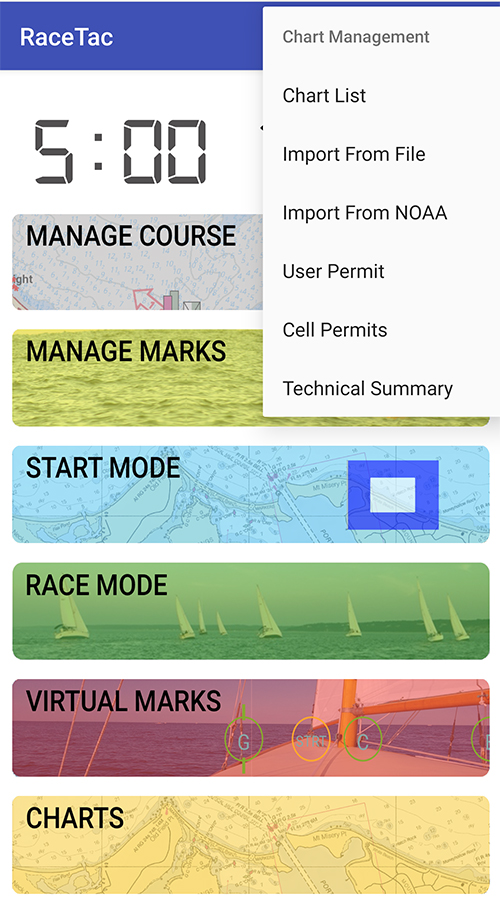
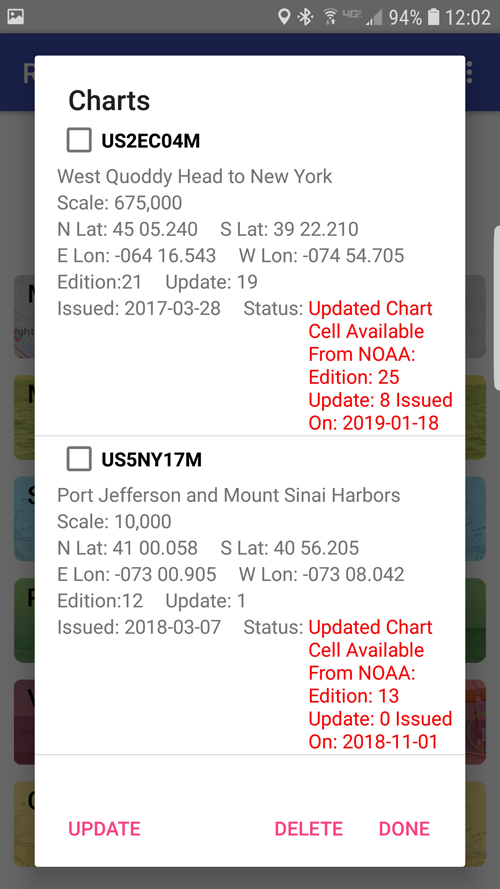
Chart Management: In the Main Menu, you will see an entry for 'Chart Management'. Selecting it will display a sub-menu as shown to the left. Selecting 'Chart List' will show a list of currently imported charts as shown below. You can DELETE or UPDATE a chart (if the Status shows an update is available as shown below) by tapping the check box on one or more charts and then hitting the button. A DELETE will delete the imported data, but will not remove the ZIP file you used for importing the chart. The Status shows 'OK', or some other important data like the availability of an update, or an expiration in the ase of licensed S63 charts.
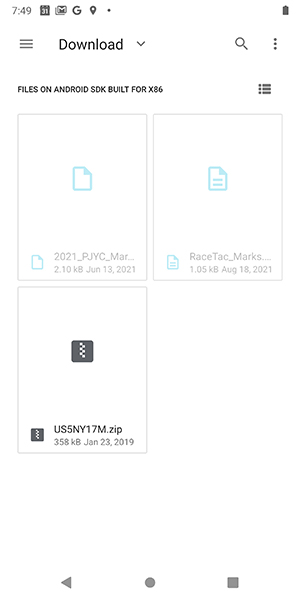
Importing: Choose the 'Import From File' item from the menu above to get the dialog to the left, which is the Android standard file dialog. In that dialog, you can either navigate to your download folder or other location, and tap the ZIP filename for the chart. OR, choose the 'Import From NOAA' button to get a list of available Charts (See below for more detail on that dialog). Charts are named after the 'Cell ID' for the area covered. So a NOAA file would be something like 'US4NY1GM.zip' . The file import works for unlicensed charts from NOAA, as well as licensed charts using the S63 standard. Click HERE for more info on licensed chart support.
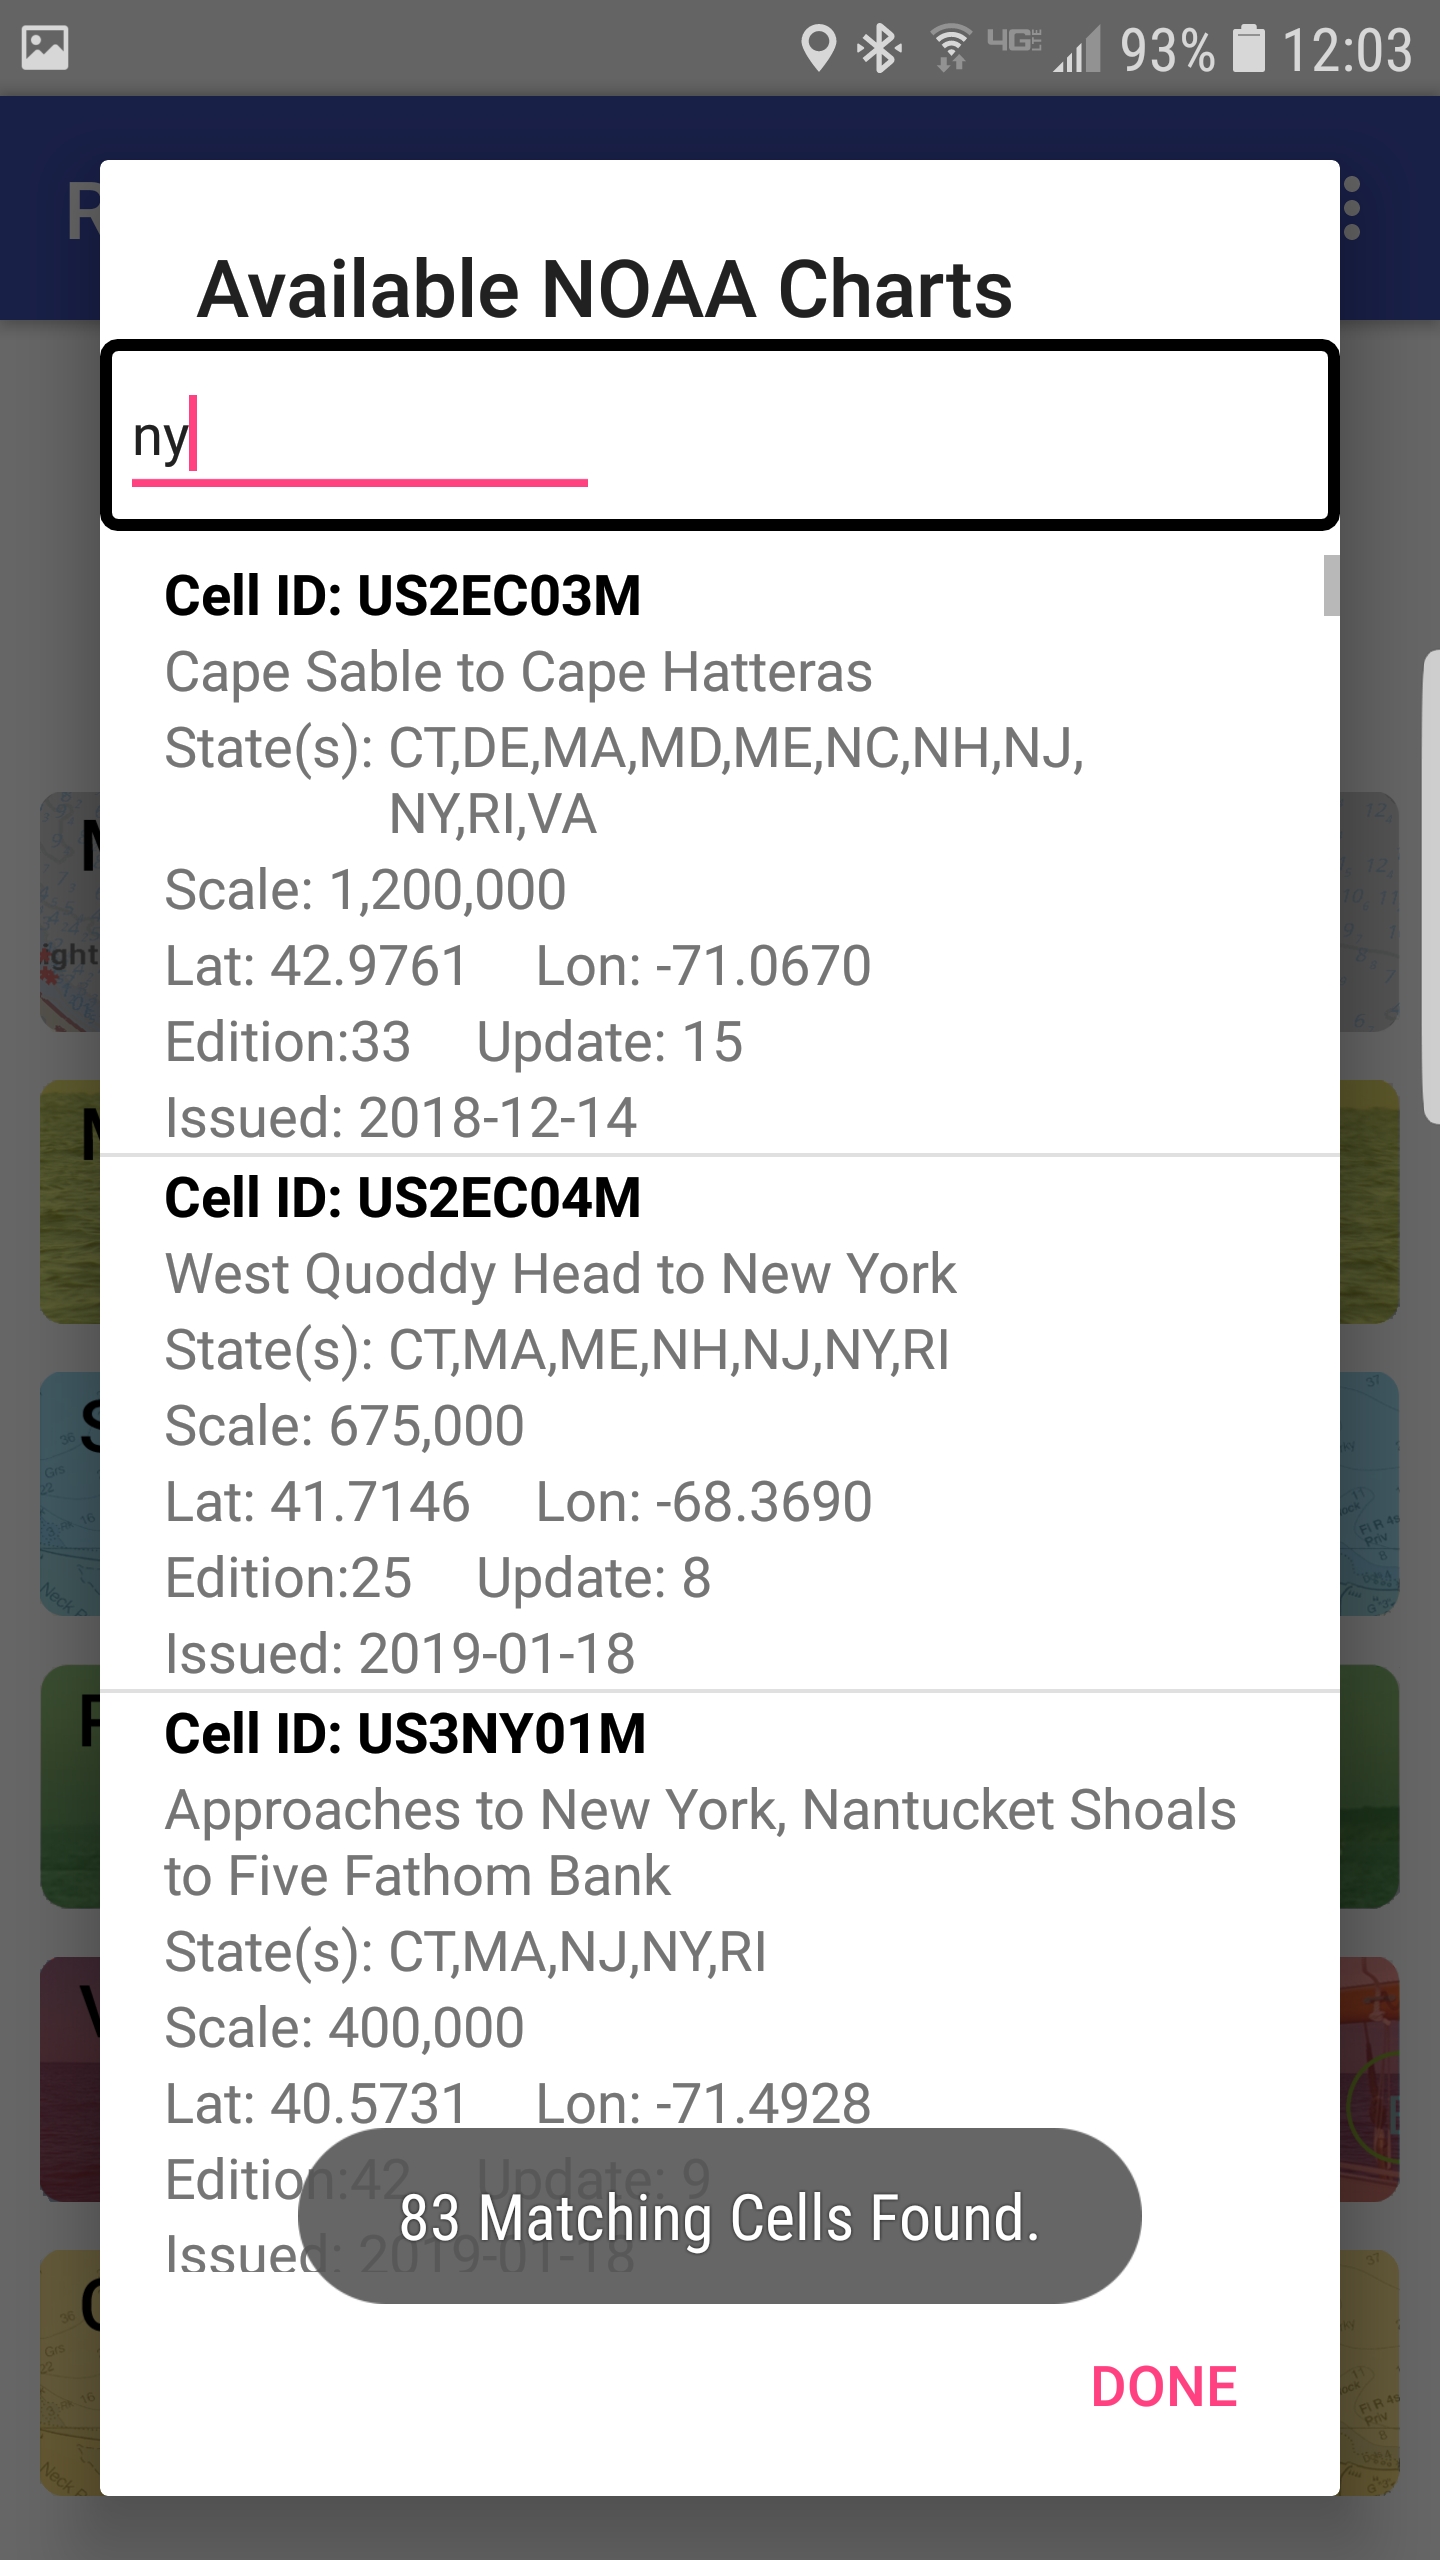
Importing from NOAA: After tapping the NOAA button above, the dialog to the left pops up. NOAA publishes over 1,200 charts, so there is a search box at the top. You can type any text and hit the enter/search button on the keyboard and it will filter the list down. It does case-insensitive match against the Cell ID, the list of States, and the description of the chart. In this example, we searched for 'ny' to find charts covering some NY state waters. Then just tap anywhere in the box for the chart, and you will get a final prompt dialog to do the import. The Latitude and Longitude shown are roughly the center of the chart. NOTE: Internet access is required to reach NOAA's servers.
Finding Charts: NOAA Has a graphical page to find ENC charts. Click HERE. You can simply find the chart cell id on their website, and just enter it in the search box.
Chart Features and Behavior
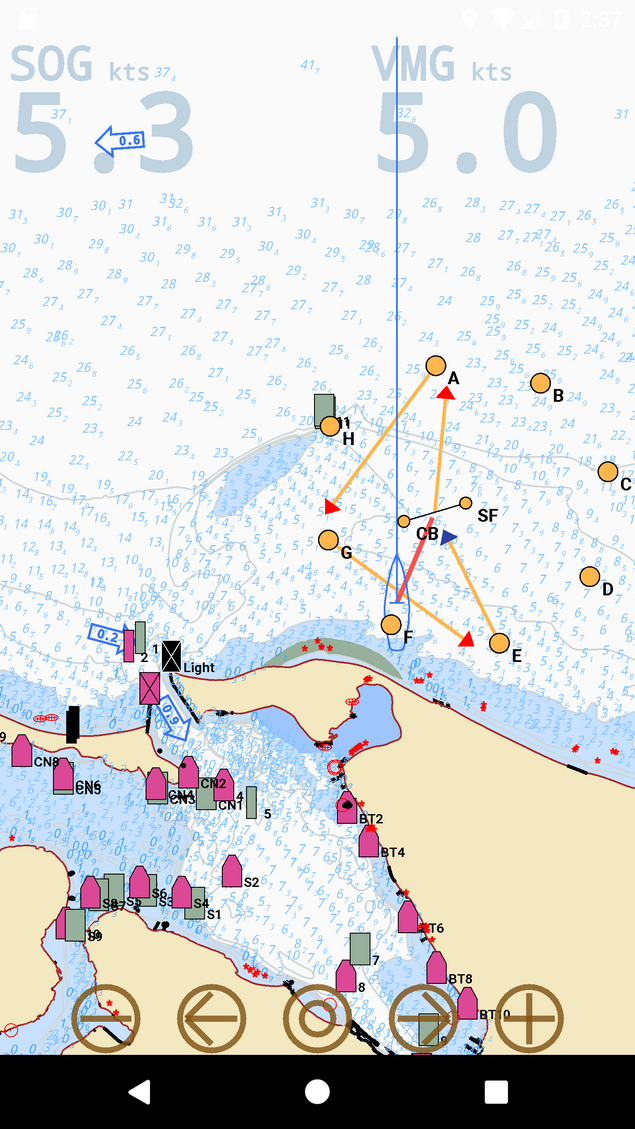
Chart Display You will recognize the basic nautical chart objects. Lateral buoys like cans and nuns, obstructions like wrecks, rocks, pilings, etc.. Also depth contour lines, and shallow areas in a darker blue. A few notes:
Obstructions Rocks show as red asterisks. In fact, obstructions are generally shown in red. Wrecks show as the common 'fish bones' symbol. A general obstructed area is an area with a red outline. Most obstructions deeper than your 'Safe Depth' (see preferences) are not shown.
Navigational Aids (Government Marks) Cans are shown as the usual rectangles, nuns (conical) are shown in the usual shape. Colors are as usually indicated. Day Marks and Light Houses are shown as a rectangle with a contrasting cross through them, sort of to indicate the lattice structure. Navigation Aids with 'Cardinal Indicators' are shown with the traditional triangles above them to indicate you have to stay clear in some way.
Tidal Currents The chart displays Tidal Current "Prediction Stations" from NOAA or the UK Hydrographic Office as arrows, with the current speed prediction in the units of speed you chose in your settings. They are colored blue for a flood, and red for an ebb (NOAA), or just blue for the UK provided values. Note that these are predictions only, and can be affected by weather and other local effects. You can tap on an arrow to get a pop-up graphical display that can be scrolled. You can also get station details and a text version of the data from that pop-up.
Shore Lines Regular shoreline is a brown line surrounding a land area. However a man made structure such as a bulwarks, breakwater, docks, are drawn in black.
Depths Soundings are light blue depths shown as the whole unit (as you selected in the preferences) and the decimal fraction to 1/10th shown as a digit that is smaller and to the right and below the whole unit. There is a preference to not show soundings that are deeper than the safe depth you choose. Depth contours are shown as light blue lines. Depth Areas are only colored in if shallower than your 'Safe Depth'.
Areas Unlike some charts, RaceTac does not differentiate different classes of land or sea areas. So a marsh is just a shallow sea area, and will not be in a different color, or have the 'grass' symbol. This app is for racing. Land areas are also all one color. No roads or land structures are drawn at present (Except daymarks and lights). So no buildings, tanks, towers, etc...
Names Navigational Aids are named with their 'short name' that is the one you are used to seeing. Marks are labeled with the names from your list of marks in the current venue.
Racing Objects Racing Marks for the current venue are shown as small circles with a black outline. Marks in the course are orange, marks not in the current course are in yellow. Marks that are ends of gates, such as my 'SF' buoy in the screenshot, and the 'CB (Committee Boat), are smaller circles in their color, with a line between them. 'Restricted' Marks (aka 'Passing Marks') will blink with a circle around them in the color indicating the side they need to be left on. These are not regular course marks, meaning they do not have to be 'rounded', but indicate you need to stay clear. Used in distance races mostly, or to indicate an area to stay clear of like government security areas. Can be placed in the course, or not. Can be set at the 'Mark' level (See editing marks in the Technical Info page), or overridden at the Course level. NOTE: If a Mark was created from a Navigation Aid, and the name is the same, only one name will be shown, in order to help 'de-clutter' the display.
Course Lines are shown in orange with arrows from the start to the finish. The current leg is shown in green. If you have chosen to indicate a 'rounding side' (leave mark to port or starboard) the head of the arrow indicates the side to leave the mark on. Red or Green. If no preference is selected, it shows as blue. Also, the line will be tilted slightly to the proper side. NOTE: 'Course Routing' will draw the course legs to honor any 'Restricted' Marks. Thus, if a restriction says you should leave it to port, but the leg between regular marks already would leave it to port, then it will not be shown as a leg. Remember that a 'Restricted' mark does not have to be 'rounded', just kept to one side or the other or generally kept clear of.
Bearing Line An optional red line from the boat to the current mark, so you can visually see your boat heading vs your bearing to the mark. This obeys the 'Gate Line' options, so it will draw either to the middle of a gate or the closest end, as per your setting for gates.
Laylines Optional 45° laylines to the mark. Found in preferences and on the chart pop-up dialog (see below).
Past Track This is an option to draw your track, color coded from yellow through green blue and red based on speed, as you race. The track starts from when the start timer is running, thru the finish, or when the timer is stopped. These tracks are saved, and you can display them on the chart using the chart pop-up options dialog (detailed below).
Other data Superimposed on the top area of the chart, partly transparent, are your current Speed over ground (SOG) and Velocity made good (VMG). The VMG is currently VMG-C (VMG on the course) which is the VMG to the next mark. (See Blog entry on VMG HERE) These are shown in units you chose in the preferences. In this shot, they are N/A because my device did not have a GPS fix at the time I took the screenshot.
Buttons: From left to right, the buttons at the bottom are:
- Zoom Out 30%.
- Backup to previous leg (Just like the 'Race Mode' displays where you can tap the marks at the top to advance or back up legs).
- Options: This circular button pops up a dialog with chart options, so you can change them right from the chart, rather than needing to go into the app 'Preferences'. See below for the 'Pop-Up Dialog' that pops up.
- Forward to next leg (if for example you are not using 'AutoRound', or rounded too far from where RaceTac thinks the mark is).
- Zoom in 30%.
Touching: The screen will respond to the usual touch and drag, and also the usual 'pinch' with two fingers to zoom in or out.>
Double Tap: Double tapping anywhere on the chart will flip back to previous mode. Such as Race Mode.
Interaction: In 1.62 and above: You can tap a Mark or a Navigational Aid. For Marks, you get options to set the location, set the rounding side, or edit the Mark info. For NavAids you get options to COPY the Aid to your Marks list, or show additional details about the Aid. NOTE: A COPY is made to your Marks list. They are not linked together. So editing your Mark will not change the Nav Aid. Also, the name will be a letter corresponding to the 'short' name as seen on the chart, with a color letter pre-pended if the name is all numeric. So a red "2" will be "R2". Some NavAids do not have names. For those, the name of the new Mark will be "NAV-" followed by the color letter, followed by a unique number starting at 1. So "NAV-R1". The next one, to prevent duplicates, if also red, would be "NAV-R2", etc... In 1.90 and above, you can tap on a 'Current Arrow' to get info about the Current Prediction Station, and see future predictions to help you plan your race.
Behavior:
AutoRound: The display will change the leg colors automatically to show the current leg in blue if 'AutoRound' is selected in the preferences.
AutoZoom: This feature zooms into your race area, depending on the stage of racing you are in. If you are 'Not Racing', which means that the race timer is not running, then this zooms to the middle of the course marks and the boat position, with all the marks and the boat on-screen. If you are 'Starting', which means the start timer is counting down, this zooms into the middle of the boat, the start mark, and the first mark after the start. If you are 'Racing', which means that you have started and the race clock is going up, then this zooms to the middle of your boat and the current mark you are heading to.
Multiple Charts: It is common to have charts of different scales loaded which overlap. For example a large base map, and then a harbor area map. RaceTac starts with the largest scale, and works down toward the highest resolution. An interesting artifact of this is that some charts are not contiguous. For example I have one that has 6 separate areas. This can cause the display to look a bit like Swiss Cheese at times, with an odd triangle here or there. This is normal with ENC Vector charts.
Chart Pop-Up Dialog
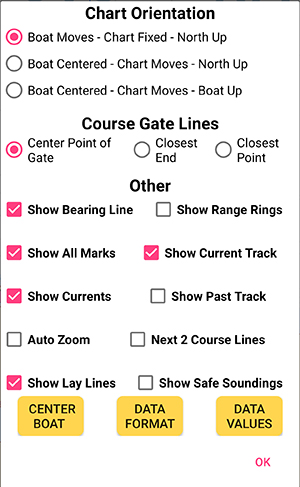
Pop-Up Options Dialog: You can directly access several common chart settings through this pop-up dialog when you hit the middle button on the chart. Note that not all settings are available here, just the common ones that you might want to change quickly while racing.
Range Rings: You can turn 'Range Rings' on and off here, but you will need to go into the main preferences menu to change the distance between rings.
Show Current Track: Will show the boat's track from the when the start timer is started until the finish. Color coded by speed. Yellow slower, red fastest.
Show Past Track: Tapping this brings up a list of past saved tracks. Tracks are saved during the race. Tapping on a race date/time will cause that track to show on the chart instead of the 'Current Track'. Just tap 'Show Current Track' again to go back to the real-time track. See below for more on this option.
Auto Zoom: Not really a setting, but a mode that you can turn on and off. See 'AutoZoom behavior' above in the general 'Behavior' section.
Next 2 Course Lines: A 'Decluttering' option. When enabled, the full course is shown before the start. After the start, only the current leg and the next one are shown.
Show Lay Lines: Display the 45° Laylines to the mark. Only displayed when racing or starting.
Show Safe Soundings: Same as the Preference described above (See Preferences section above).
'Center Boat' Button: Resets the chart to put the current boat location in the center.
'Data Format' Button: Brings up a dialog with sliders that let you change the size and opacity (transparency) of the data overlays in the top corners of the chart display.
'Data Values' Button: Brings up a dialog that lets you choose which data to display in the overlays in the top corners. Such as SOG, VMG-C, VMG-L, or Heading.
Track Details
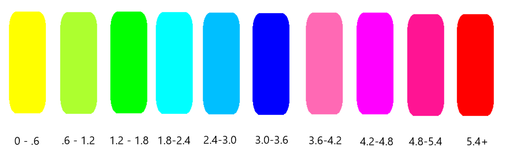
Colors: When tracks are shown on the chart, either real-time or a past saved track, they are colored by speed. The speed ranges in knots are shown here on the left.
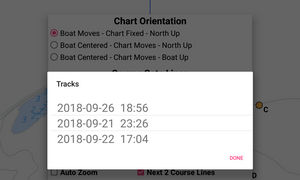
Show Past Track - Track Selection: When you click the 'Show Past Track' button on the chart pop-up dialog (shown above), you will get a list of saved tracks to choose from, labeled by the start time of the track. Just tap one to load it onto the chart display. Or hit 'Done' to just return without changing anything.