RaceTac
For Racers, By Racers
Nautical Charts have been constantly evolving since the beginning of time, and are certainly continuing to evolve rapidly today. From grids of sticks and shells and stones lashed together by the Polynesians, to modern Electronic charts in Navigation systems, Tablet computers, and Smartphones. 1893: Standards: Standards for charts is a fairly recent thing. In the early 20th century, a number of countries started working together to create standards for all things maritime, including charts. In 1921 the International Hydrographic
Organization, or IHO was founded and is based in Monaco. For charts, they set standards for things like the notations to be used, graphics that should be used to show objects like lateral buoys (Nuns, Cans, etc...), that soundings will be Mean Low Water (MLW), and the like. In more recent times, they also set standards for
the modern Electronic Nautical Charts. Now, pretty much anywhere in the world, charts look about the same. Measurements might be localized, such as depths in feet or meters or fathoms. But in Electronic charts, there is one standard, and users convert them with software (Soundings are in meters for example). Fast Forward: Today of course, we are all familiar with the availability of 'Electronic Nautical Charts' (ENCs). In fact as of 2010, the International Maritime Organization mandated that large fast vessels carry ENC systems. Previously they only were required to carry paper charts. And just recently, vessels no loner have to carry paper charts if they have a certified ENC system on board. I myself always carry a paper charts book as a backup.
I also have large format charts, but I almost never look at them unless planning a long trip in unknown waters, where the much larger form factor makes it easier to get an overview.
Print vs Electronic: NOAA in the U.S. is known for publishing printed charts. This also included digitzed versions of them known as 'Raster' charts, and were the first form of Electronic charts. You could get them in various formats including the common PDF. Or buy the printed version in various sizes. NOAA sold them until recently.
Raster charts are still just images though. The other, newer, form of Elecronic charts are called 'Vector' charts. These are actually a data file containing descriptions of the objects on a chart. Examples would be soundings with depth, lines representing a coastline or depth area, lateral bouys with names, colors, light patterns and frequencies, land areas, buildings, obstructions such as rocks and wrecks (including depths), etc. Everything you are used to seeing on a printed chart is represented in a Vector data file. Text and all. All these include coordinates in lattitude and longitude, and depth where applicable. Note these are not images, they are just data files.
Software has to draw the images, such as an image of a nun or can.
This month, NOAA announced they are discontinuing 'Traditional' Raster based charts.
Raster vs Vector: NOAA announced that Raster charts are going away. Oddly, these were not based on the same data as Vector charts. And, the Vector charts, although a much newer standard, were not as up to date as the Raster image charts. Odd that NOAA had two types of charts that didn't agree! If you bought printed charts, they might have been created from either Raster or Vector data, so charts might disagree. In my area, the Vector chart showed 3 oil tanks where our yacht club is.
The Raster did not. The oil tanks have been gone for almost 30 years! NOAA has been working their way around the US from Maine to Washington, bringing all their data up to date.
Soon the Vector chart database will be the source of truth for all NOAA charts. The future is Vector charts. Is Print Dead? You will still be able to buy printed charts. They will just be created by software from the ENC Vector database. NOAA is even planning a custom chart service where you will be able to pick an area and get a chart printed just for your requirements! ENC Standards: The new Vector chart standard is called S-57 and was created by the IHO. It defines a data file format and record formats in it, as well as definitions for what that data can represent. Most countries use the same standards, so if a developer implements NOAA ENC Vector charts, the software will also
work for UK Admiralty charts, or Australian charts, or French charts. There are other standards that reccomend how to render the data graphically, like on a screen, or in print, with things like colors, shapes, etc.
There is also a standard for licensing these charts, called S-63. US NOAA charts are free. However UK charts for example are sold by distributors, and require a license process using encryption technology. RaceTac supports S-57 and S-63 charts.
As mentioned, an S-57 chart is really a data file. Objects in it have IDs and sets of fields (called attributes) that describe them. For example, object type 17 is a lateral buoy. Type 30 is a coastline. 73 is a land area. A bouy might have attributes such as shape (conical (aka Nun), pillar (aka Can), etc...), color (one or more), Date of most recent update, a text name (Ex: 'Port Jefferson Approach Lighted Whistle Buoy PJ'), and of course it's location, and depth if appropriate like a rock, obstruction, wreck, etc...
Other ENC Vector Advantages: Besides the advantages of having customized drawing, they can also be updated more frequently. So a bouy being moved can be reflected very quickly in an update for example. In my case above, the Vector chart has already been updated to remove the 3 oil tanks. And got the installation of new Range Lights shortly after they went live. And a new lighted buoy to mark a rock just this summer. And of course it can be overlayed with additional info, such as tidal currents, even radar data or AIS vessel data.
And since a computer knows the ship location, and the location of objects on the chart, it can do things like proved alerts if approaching something dangerous like a shoal, or a bouy. It can also provide advanced features like auto-routing, sort of like a car navigation system, since it knows what is a land area vs a sea area.
Also, because they are drawn from a database of objects, they zoom perfectly. Because the computer software is redrawing everything at whatever zoom factor you want. Raster charts are fixed images. Thus as you zoom in they start to look fuzzy, and as you zoom out everything can get too small to read. But Vector chart software may keep text at a fixed readable size for example, regardless of zoom factor. And may only let bouy icons get so small and not smaller (or larger).
It also keeps up with technology. For example some lateral buoys also have AIS IDs, and will show up on an electronic AIS display. Some marks will respond to radar pings with ID info, and that capability will be noted.
What about printed charts again? You can still get printed charts. They will soon all be created from ENC Vector data though. Even today, many are created from the Vector data. You can even get a type called Print-On-Demand (POD) charts. They are called this because they are printed when you order them, just for you. And since ENC Vector data is frequently updated, you will get the most recent data, not a 20 year old picture! But check different vendors, because the charts might look slightly different, even though the exact same data is on them. You may prefer one vendor over another. More Resources:
Charts - November 22, 2019
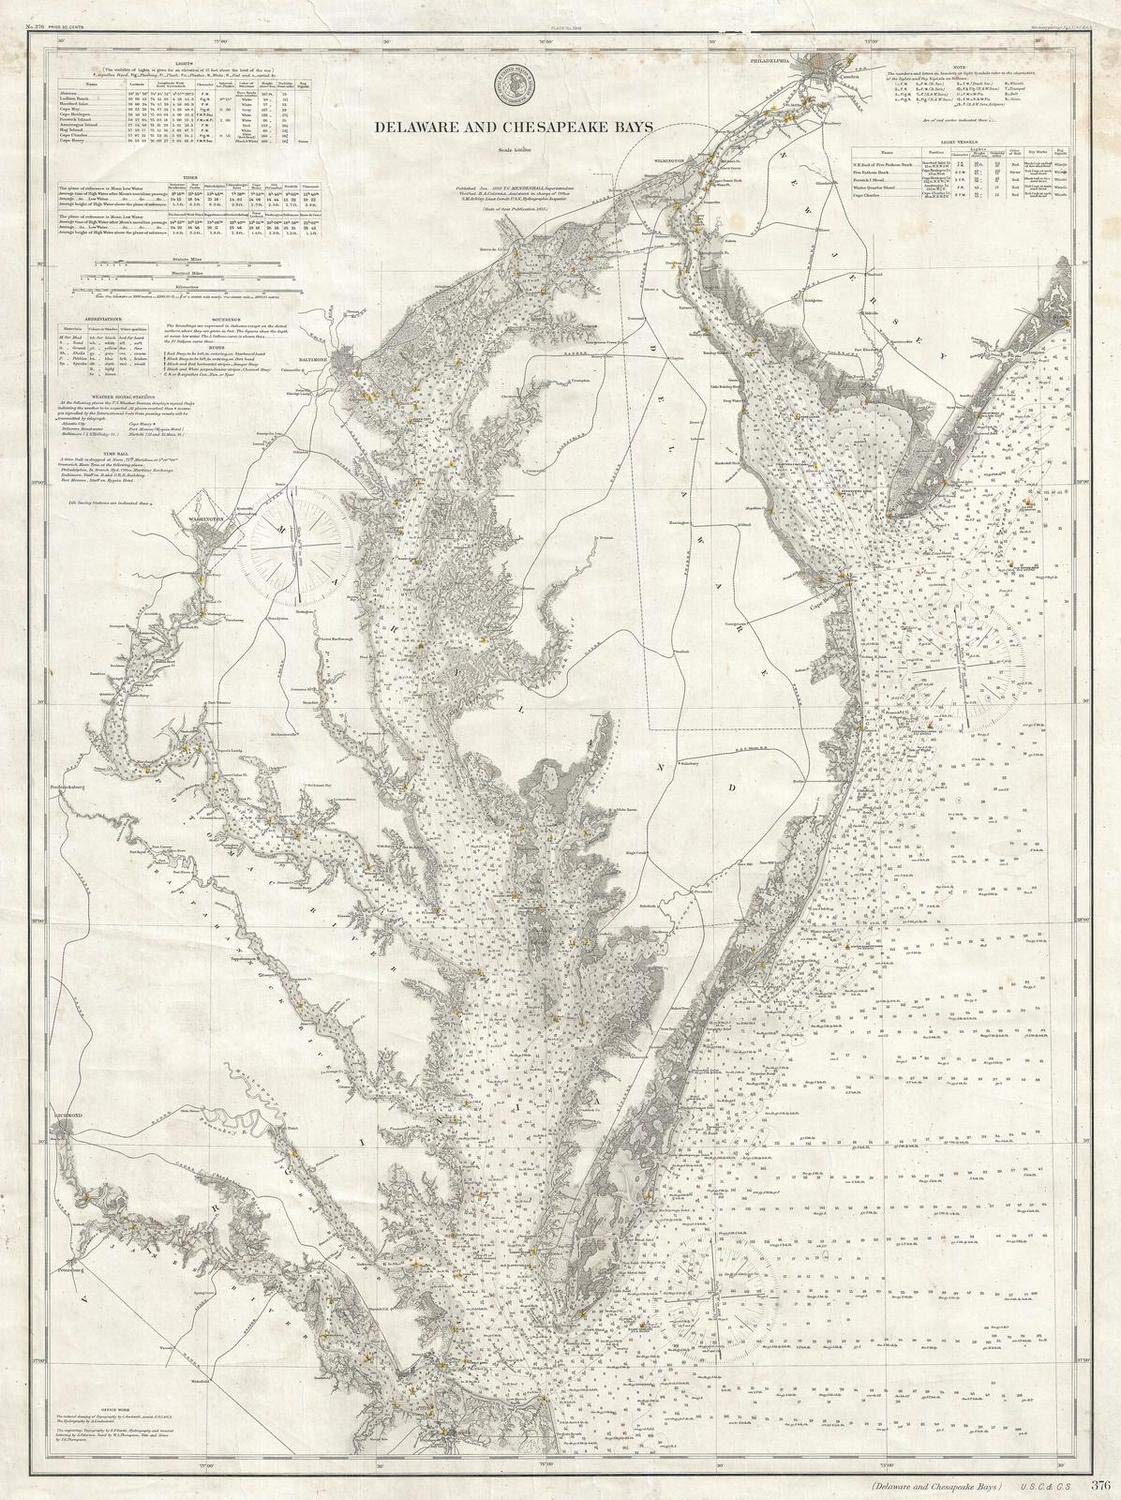 In the very early days charts were individually done by hand, and captains would have them drawn up by craftsmen. After that period, and up until fairly recently, maybe the last 20 years, Nautical Charts were primarily printed. Before about the late 1980's they were hand drawn like the chart at the left from 1893, and then printed on a printing press.
This was of course very time consuming, so chart changes did not come out very often.
With the advent of computers and chart-plotters, the data about what is on a chart could be stored
in a database, and updated easily. Then graphics software would render the image, and the result printed on a plotter, and then sent to the printers for high volume replication.
In the very early days charts were individually done by hand, and captains would have them drawn up by craftsmen. After that period, and up until fairly recently, maybe the last 20 years, Nautical Charts were primarily printed. Before about the late 1980's they were hand drawn like the chart at the left from 1893, and then printed on a printing press.
This was of course very time consuming, so chart changes did not come out very often.
With the advent of computers and chart-plotters, the data about what is on a chart could be stored
in a database, and updated easily. Then graphics software would render the image, and the result printed on a plotter, and then sent to the printers for high volume replication.
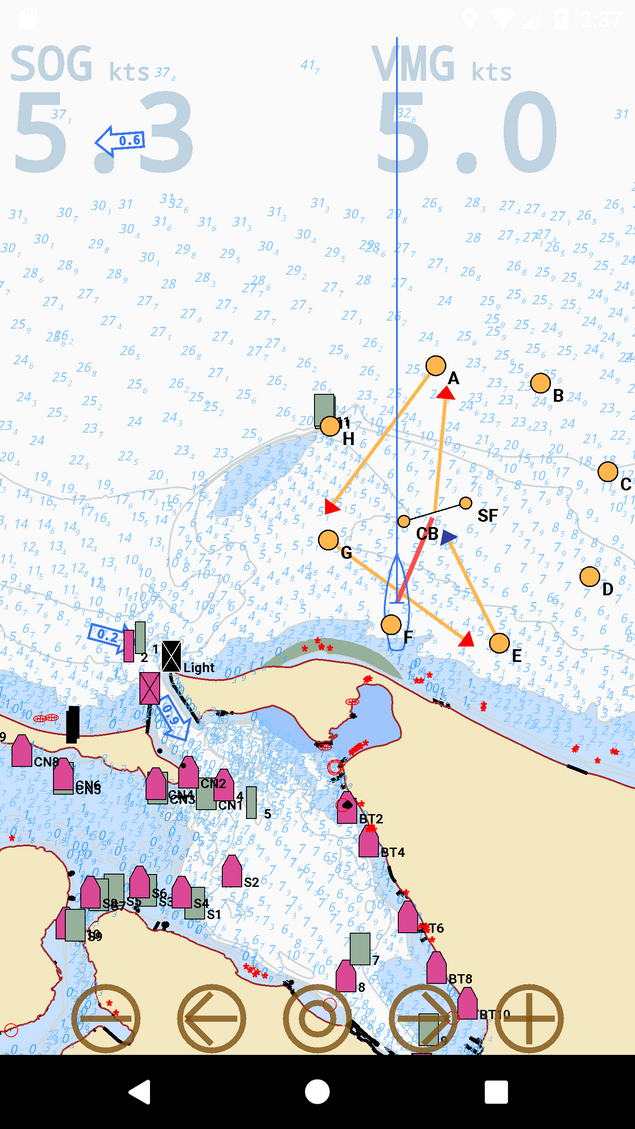 RaceTac Chart Screen: One big advantage of ENC Vector charts is that the software can draw them anyway it wants. Or even warn you about shallow depths or obstructions. Remember that these are obects with data about them, not just pictures. For example, RaceTac is designed for racing, not regular navigation, so
it does not show all the details about marks, to make it easier to visualize with a quick glance. Less clutter! But you can tap a mark or buoy and get a pop-up with the details. You can also choose to remove safe depth soundings to help declutter the screen to make it easier to read quickly. And it can be colored differently at night for preserving your night vision. You can draw objects at different sizes to make it easier to see quickly. You cannot do this with the so called 'Traditional' charts.
RaceTac Chart Screen: One big advantage of ENC Vector charts is that the software can draw them anyway it wants. Or even warn you about shallow depths or obstructions. Remember that these are obects with data about them, not just pictures. For example, RaceTac is designed for racing, not regular navigation, so
it does not show all the details about marks, to make it easier to visualize with a quick glance. Less clutter! But you can tap a mark or buoy and get a pop-up with the details. You can also choose to remove safe depth soundings to help declutter the screen to make it easier to read quickly. And it can be colored differently at night for preserving your night vision. You can draw objects at different sizes to make it easier to see quickly. You cannot do this with the so called 'Traditional' charts.